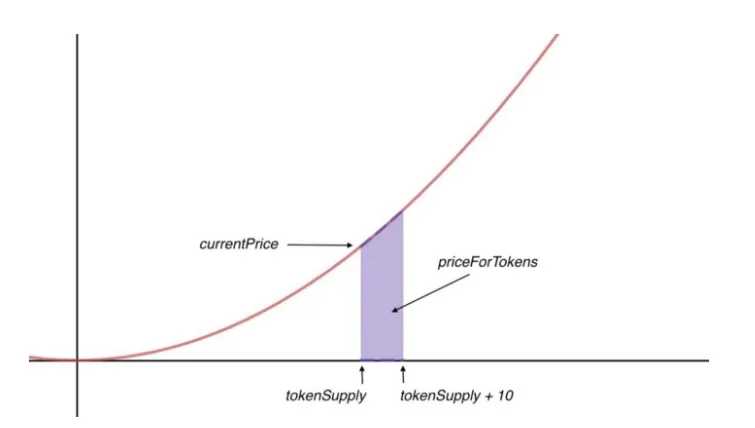
Unlike traditional bonding curves that use complex continuous functions, Pump.fun utilizes a simplified linear model. The core principle remains the same: the price of a token is directly related to its supply, but in a more straightforward manner.
Here’s a breakdown of the key elements in the Pump.fun bonding curve math formula, in a simplified form:
- Fixed Price Tiers: Pump.fun divides the bonding curve into discrete price tiers, or “buckets.” Each tier has a fixed price and a predetermined number of tokens that can be bought or sold at that price.
- Price and Supply: When you deploy a token on Pump.fun, you need to deposit an initial amount of SOL into the bonding curve smart contract. This initial deposit determines the starting price and the initial supply of the token.
- Buying and Selling: Each buy increases the price to the next tier. Each sell decreases the price to the previous tier.
- Formula in General: Price of token = f(amount of reserve, formula). The amount of reserve changes along with the buy and sell of the token, and the formula is defined when deploying the token.
Pump.fun Bonding Curve Math Example: Let’s Get Practical
Let’s illustrate the Pump.fun bonding curve math with a concrete example:
- Deployment: A meme coin developer deploys a new token on Pump.fun, depositing 1.2 SOL into the bonding curve. The bonding curve is configured with an initial price of 0.01 SOL per token.
- Initial Purchase: A user buys 10 tokens. They pay 0.1 SOL (10 tokens * 0.01 SOL/token). The price moves up to the next tier, let’s say 0.011 SOL per token.
- Second Purchase: Another user buys 20 tokens. They pay 0.22 SOL (20 tokens * 0.011 SOL/token). The price moves up to the next tier, 0.012 SOL per token.
- Sell: The first user decides to sell 5 of their tokens. They receive the current price for each tier they sell into, generating a small profit (minus fees). The price drops down a tier.
Pump.fun Bonding Curve Math Calculator: A Helpful Tool (Currently Unavailable)
While a dedicated Pump.fun bonding curve math calculator would be incredibly useful for projecting potential profits and losses, there isn’t an official one readily available. However, users can still perform calculations manually by:
- Knowing the Bonding Curve Parameters: Obtain the initial price, the price increment per tier, and the number of tokens per tier.
- Tracking the Current Tier: Monitor the current price tier on the Pump.fun interface.
- Manual Calculation: Use a spreadsheet or a simple calculator to simulate buy/sell scenarios and estimate price movements based on the bonding curve parameters.
The Implications of Pump.fun’s Bonding Curve Model
- Early Advantage: Early buyers often benefit the most as they enter at lower price tiers and can ride the upward price momentum.
- Volatility: Price can fluctuate rapidly as users buy and sell, especially with the hype surrounding meme coins.
- Liquidity: Once a token reaches a certain threshold on its bonding curve, it becomes eligible to be listed on the Raydium decentralized exchange. This provides an exit ramp (or an entry point for new users), but it also decouples the token from the Pump.fun bonding curve mechanics. Then the price will depend on market supply and demand.
Conclusion: Understanding the Math is Key
Pump.fun bonding curve math is relatively straightforward, but it’s essential to grasp the underlying mechanics to assess the risks and potential rewards. While the platform has democratized meme coin creation and trading, it’s still a highly speculative environment. Remember to do your research, understand the bonding curve parameters of any token you consider, and only invest what you can afford to lose. By understanding the math, you can make more informed decisions in the exciting, yet volatile, world of Pump.fun.
